 US Dollars
What is an Area of Opportunity?

Please note, this content is for informational purposes only, you should not construe any such information or other material as legal, tax, investment, financial, or other advice. The ownership of any investment decision shall exclusively vest with you after all possible risk factors and by exercise of his/her/its independent discretion and Parley Labs Holding Inc. shall not be liable or held liable for any consequences thereof.
We continue to search for new areas of opportunity to grow The People’s Network. Using on chain data helps us identify where coverage is needed while maximizing rewards. Gateways in these areas will provide coverage to be utilized for GPS trackers, smart cities, and connected devices that extend beyond WiFi at a significant reduction in cost versus cellular connectivity. We will start to see more Helium based products launching over the next few months, building more value for the network and thus the rewards that we earn. So let us dig into what an area of opportunity is.
There are two areas that we consider opportunities:
- An area that is not overly dense that can benefit from additional coverage, growing outward from a dense region.
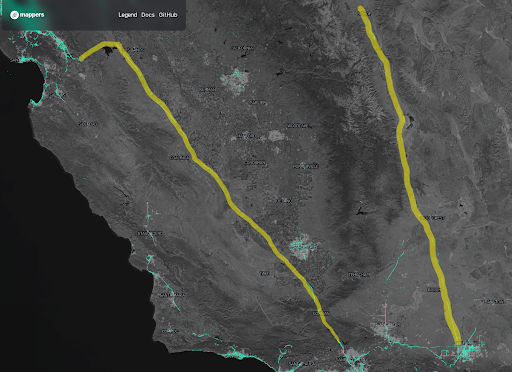
- An area that is lacking coverage but is highly traveled between two regions. Generally major travel routes between major hubs. For example, between Victorville and Mammoth or LA and Northern California:
Why do these two areas matter? Because they help provide better coverage for two types of applications:
- Ubiquitous coverage around major hubs and growing outwards from there. This allows solutions and products to have far reaching use cases beyond just the major cities, but into the regions beyond.
- For applications such as asset tracking, having coverage between major metros is important. By building coverage in these extended areas, we enable cheaper tracking solutions and new products that extend beyond city centers.
How do we identify these areas?
We look at three things: Helium Explorer, On chain data and Helium Mappers. Helium Explorer shows a general coverage map along with transmit scaling of hotspots. If you’re not familiar with Transmit Scaling, read this blog post. On-chain data tells us statistics on the operations of a region of hotspots. Helium Mappers gives us some insight into the quality of coverage in a region from actual devices.
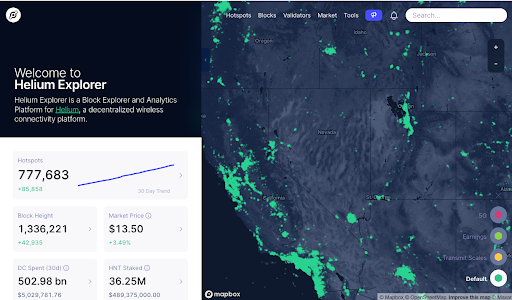
When looking at the map, you can turn on the transmit scaling filter. Simply click on the filter image on the bottom right to turn on Transmit Scaling. Red means that area has a lot of hotspots and they’re all sharing the rewards going to that region (transmit scale is very small, less than 0.1).
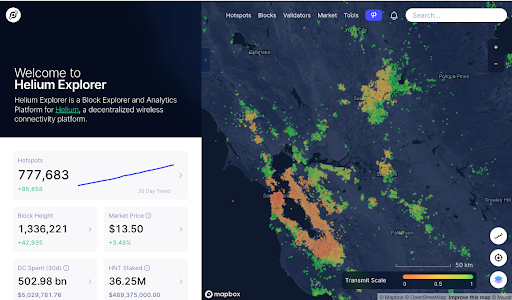
As you go outwards towards green, you’ll start seeing areas of opportunity where you are near other hotspots, but have a transmit scale closer to one (1). You don’t want to be too far away from these as you’ll witness less hotspots, but this is how coverage can grow out towards less dense regions.
Once we’ve loosely identified these regions, we use the mappers project to give us a bit more insight into the quality of coverage.
We then begin to look at the blockchain data to help us gain an understanding of how hotspots in that region perform. Between these three, we can give you a really good idea of how well the region’s Helium coverage is.
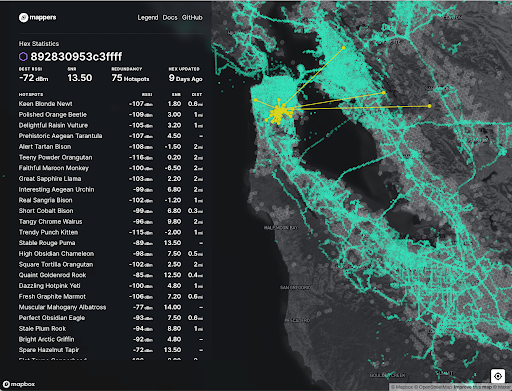
What on chain data do we look at?
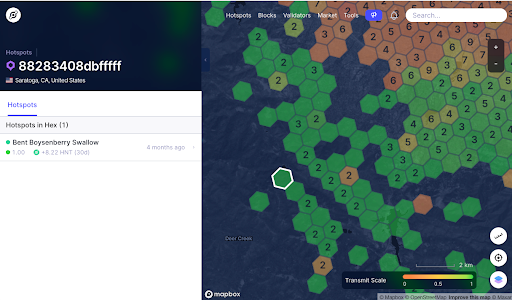
There’s a few ways to do this, but we look at a specific point in that region, pull hotspot data around a radius of that location and look at the following statistics:
- Transmit Scaling
- How many online vs offline
- 30 day rewards of online hotspots
- Average earnings of all hotspots
- Top earner
- -25% hotspots are earning over what amount?
For example:
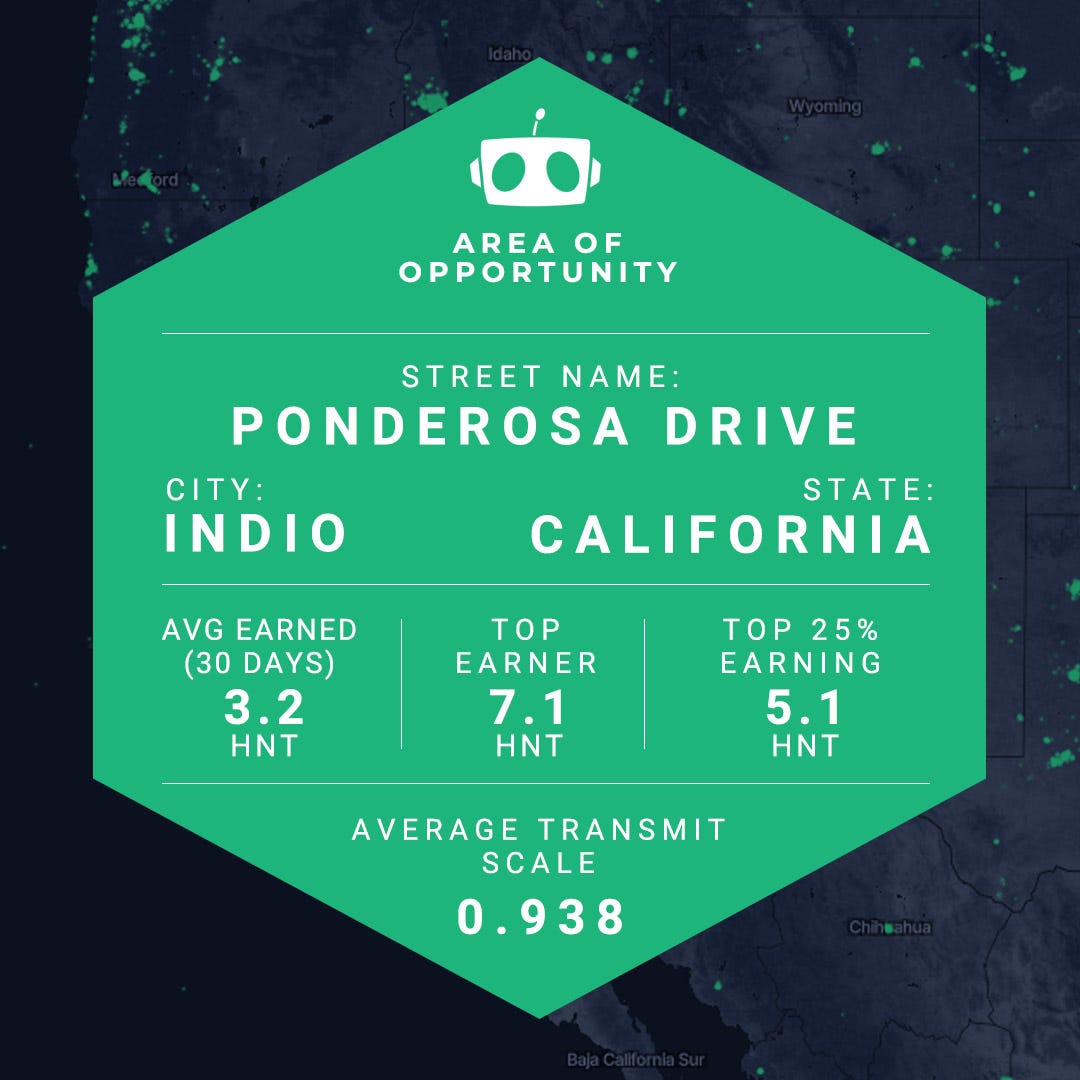
This information gives you a good indication of how far out you can go to add coverage while understanding what you can earn. Remember, at the end of the day it’s all about how much useful coverage we’re building.
Great coverage enables great products to be built on top. Traditional cellular based asset tracking can cost $20+/month per device, whereas tracking solutions on the Helium network can be $2–5/month (up to 10x cheaper). For tracking in Southern California, you can see how good the coverage is and how well assets can be tracked.
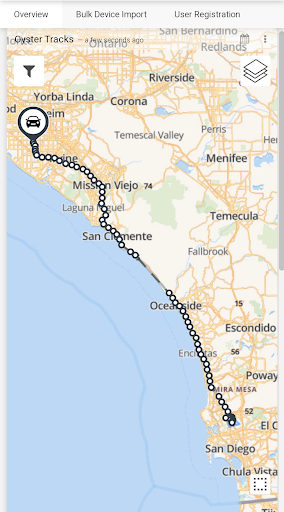
Great coverage in Southern California. Note the gap is between military zone where no hotspots have been installed.
Everything from smart agriculture for community gardens, asset tracking for your loved ones or expensive rental equipment, sustainable community programs around water management, air quality and weather, can all be built with little to no infrastructure cost.
Finding different ways to grow The People’s Network is a passion at Parley Labs. If you would like to discuss further or share your ideas please feel free to reach out at solutions@parleylabs.com.