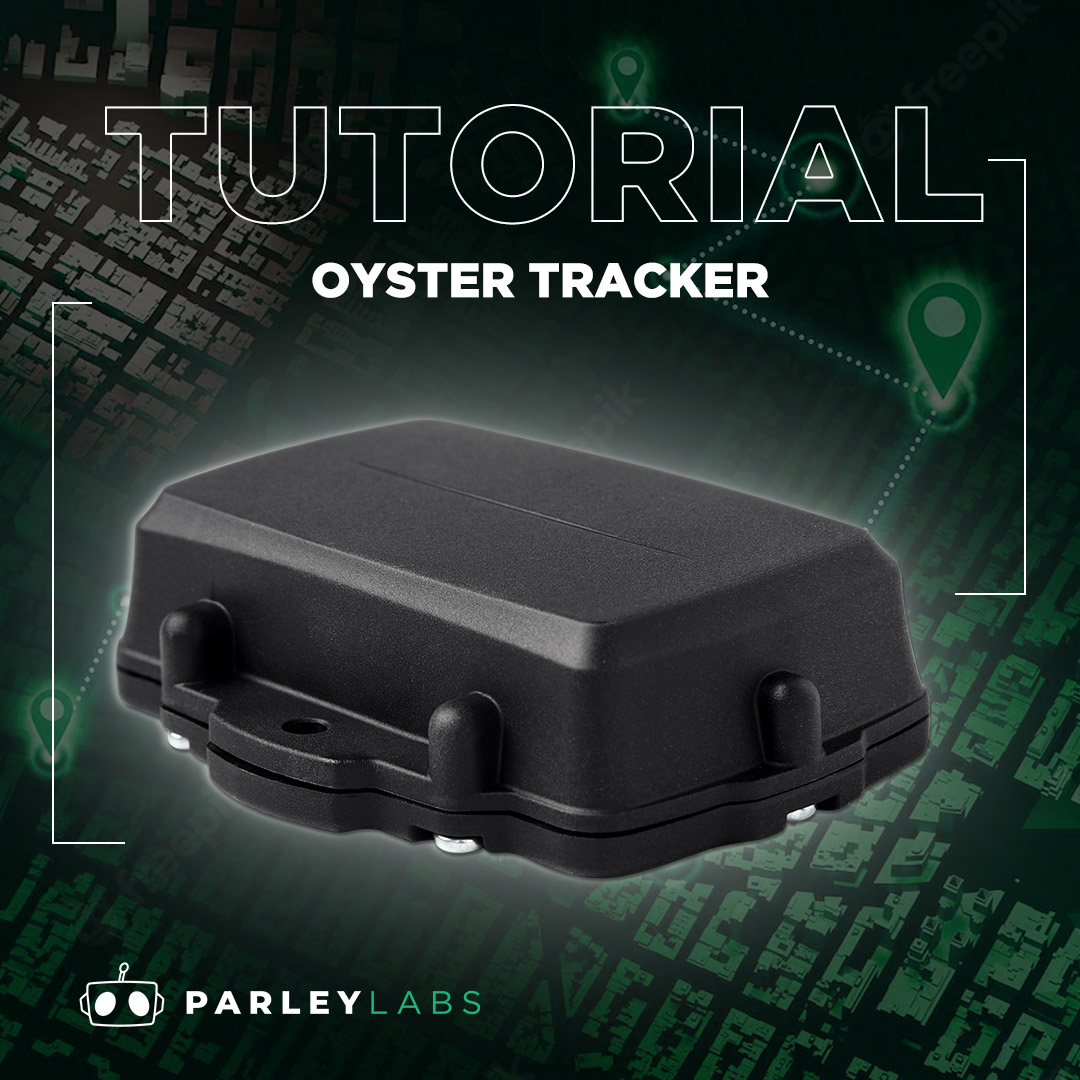
Oyster Tracker Helium and Tago Tutorial
Adding Oyster Tracker to the Helium Network
1. Register for a Helium Console Account
We will be using the Helium Network as our LoRaWAN network provider because of their large network coverage and low fee. You can check out more about them here.
In order to receive data from the Helium LoRaWAN network, we will create a Helium Console account here. Once you created the account and logged in, you will see the following page:
2. Adding Data Credit
Every new Helium Console account comes with 10,000 data credit which will provide about 2 months of data. However, if you want to add more, hover over the DC balance on the top right of your screen and click on "DC Balance" which will take you to the following screen. The minimum purchase with credit card is $10 which will give you plenty of data credit to use with the sensor.
3. Adding OysterTracker to the Helium Network
Select "Devices" on the left column, then "Add New Device". Enter a name for your device and populate the Dev EUI, APP EUI and App Key. Once completed, proceed to "Save Device".
4. Adding Payload Decoder
Select "Functions" on the left column, then "Add New Function". Set all fields the same as seen below.
Copy and paste the following function into the custom script box.
function Decoder(bytes, port) {
var payload_index = bytes[2];
var decoded_frame ={};
//Payload index of 0 contains air temperature (C) and air humidity (%)
decoded_frame.lat = (((bytes[3]<<24 | bytes[2]<<16 | bytes[1]<<8 | bytes[0])^0x01)-1)/1e7;
decoded_frame.lng = (((bytes[7]<<24 | bytes[6]<<16 | bytes[5]<<8 | bytes[4])^0x01)-1)/1e7;
decoded_frame.inTrip = ((bytes[8] & 0x1) !== 0) ? true : false;
decoded_frame.fixFailed = ((bytes[8] & 0x2) !== 0) ? true : false;
decoded_frame.headingDeg = (bytes[8] >> 2) * 5.625;
decoded_frame.speedKmph = bytes[9];
decoded_frame.batV = bytes[10] * 0.025;
decoded_frame.manDown = null;
return decoded_frame;
}
Setting Up Tago.IO for Data Visualization
-
Register for a Tago.IO Account
In this guide, we will use Tago.IO to display all data coming from Helium. Register for a free account with Tago and once you are logged in, you will see the following screen.
2. Add New Device to Tago
Select "Devices" on the top left corner, then select "Add Device".
Select "LoRaWAN Helium", then select "Custom Helium" as shown below.
Once you selected "Custom Helium", the following screen will appear. Give your Oyster tracker a name and set the "Data Storage Type" to "Device Data Optimized". For data retention, set your desirable timeframe that you want Tago to retain data. In this example, we will set it to one month. Fill in the EUI field with the Dev EUI. Once done, press "Create My Device",
3. Add Oyster Tracker Dashboard to Tago
Use the following link to automatically install the Oyster Tracker dashboard to your Tago account. Select "Install Template" when prompted as shown below.
Select the device name that you added earlier from the drop-down menu. Select "Confirm associations" once you are done.
4. Adding Tago Authorization to Helium Console
At this point, you will see the newly created dashboard on your homepage. However, the dashboard should be empty since you have not gotten any data yet due to the fact that we have not link the Tago account to our Helium Console account. To do this, select your profile name on the top right corner, then select "My account"
Select your profile name on the left, then click on "Token", set permission to "full", and to never expire, then "Generate Token". In order to copy your token, click on the copy symbol as show below.
Now log back into your Helium Console account, click on "Integrations" on the left column then add TagoIO.
Paste your newly created Tago token in the Step 2 box below.
5. Flow Diagram
Finally, we are on the last step. This step will tie everything that we did previously together and allow you to see all data output on Tago.IO.
While in Helium Console, click on "Flows", then add the following items and connect them together. In our case, we will add the Oyster tracker, Oyster decoder function and the TagoIO authorization.
TagoIO Dashboard Visualization
Congratulation, you are now done! Go back to your Tago dashboard and see all the data fields getting populated as more data come through!

 US Dollars
